 James Dunkerley
Introduction
In this post, I will use Enso to read and process a CSV file. Enso is being designed and built to make it easier to process, blend and analyse data. It is a new programming language designed to have a dual representation both as text and as a visual graph.
The dataset used in this walkthrough is available from Kaggle here. The goal of this post is to cover reading this data and finding the five highest-value furniture sales.
Installing and Getting Started
Let’s start by getting Enso installed. It will work on Windows, Mac, and Linux. This guide is based on Windows. You can download the installer from here. Download the appropriate Enso IDE entry for your operating system and run it.
On Windows, you must have the Visual C++ Restributable installed. If you don’t have it, you can download it from here.
Once the installation has been completed, you can launch Enso from the start menu or desktop shortcut. It may need to be approved by your firewall. Once it has started, you will see the following screen:
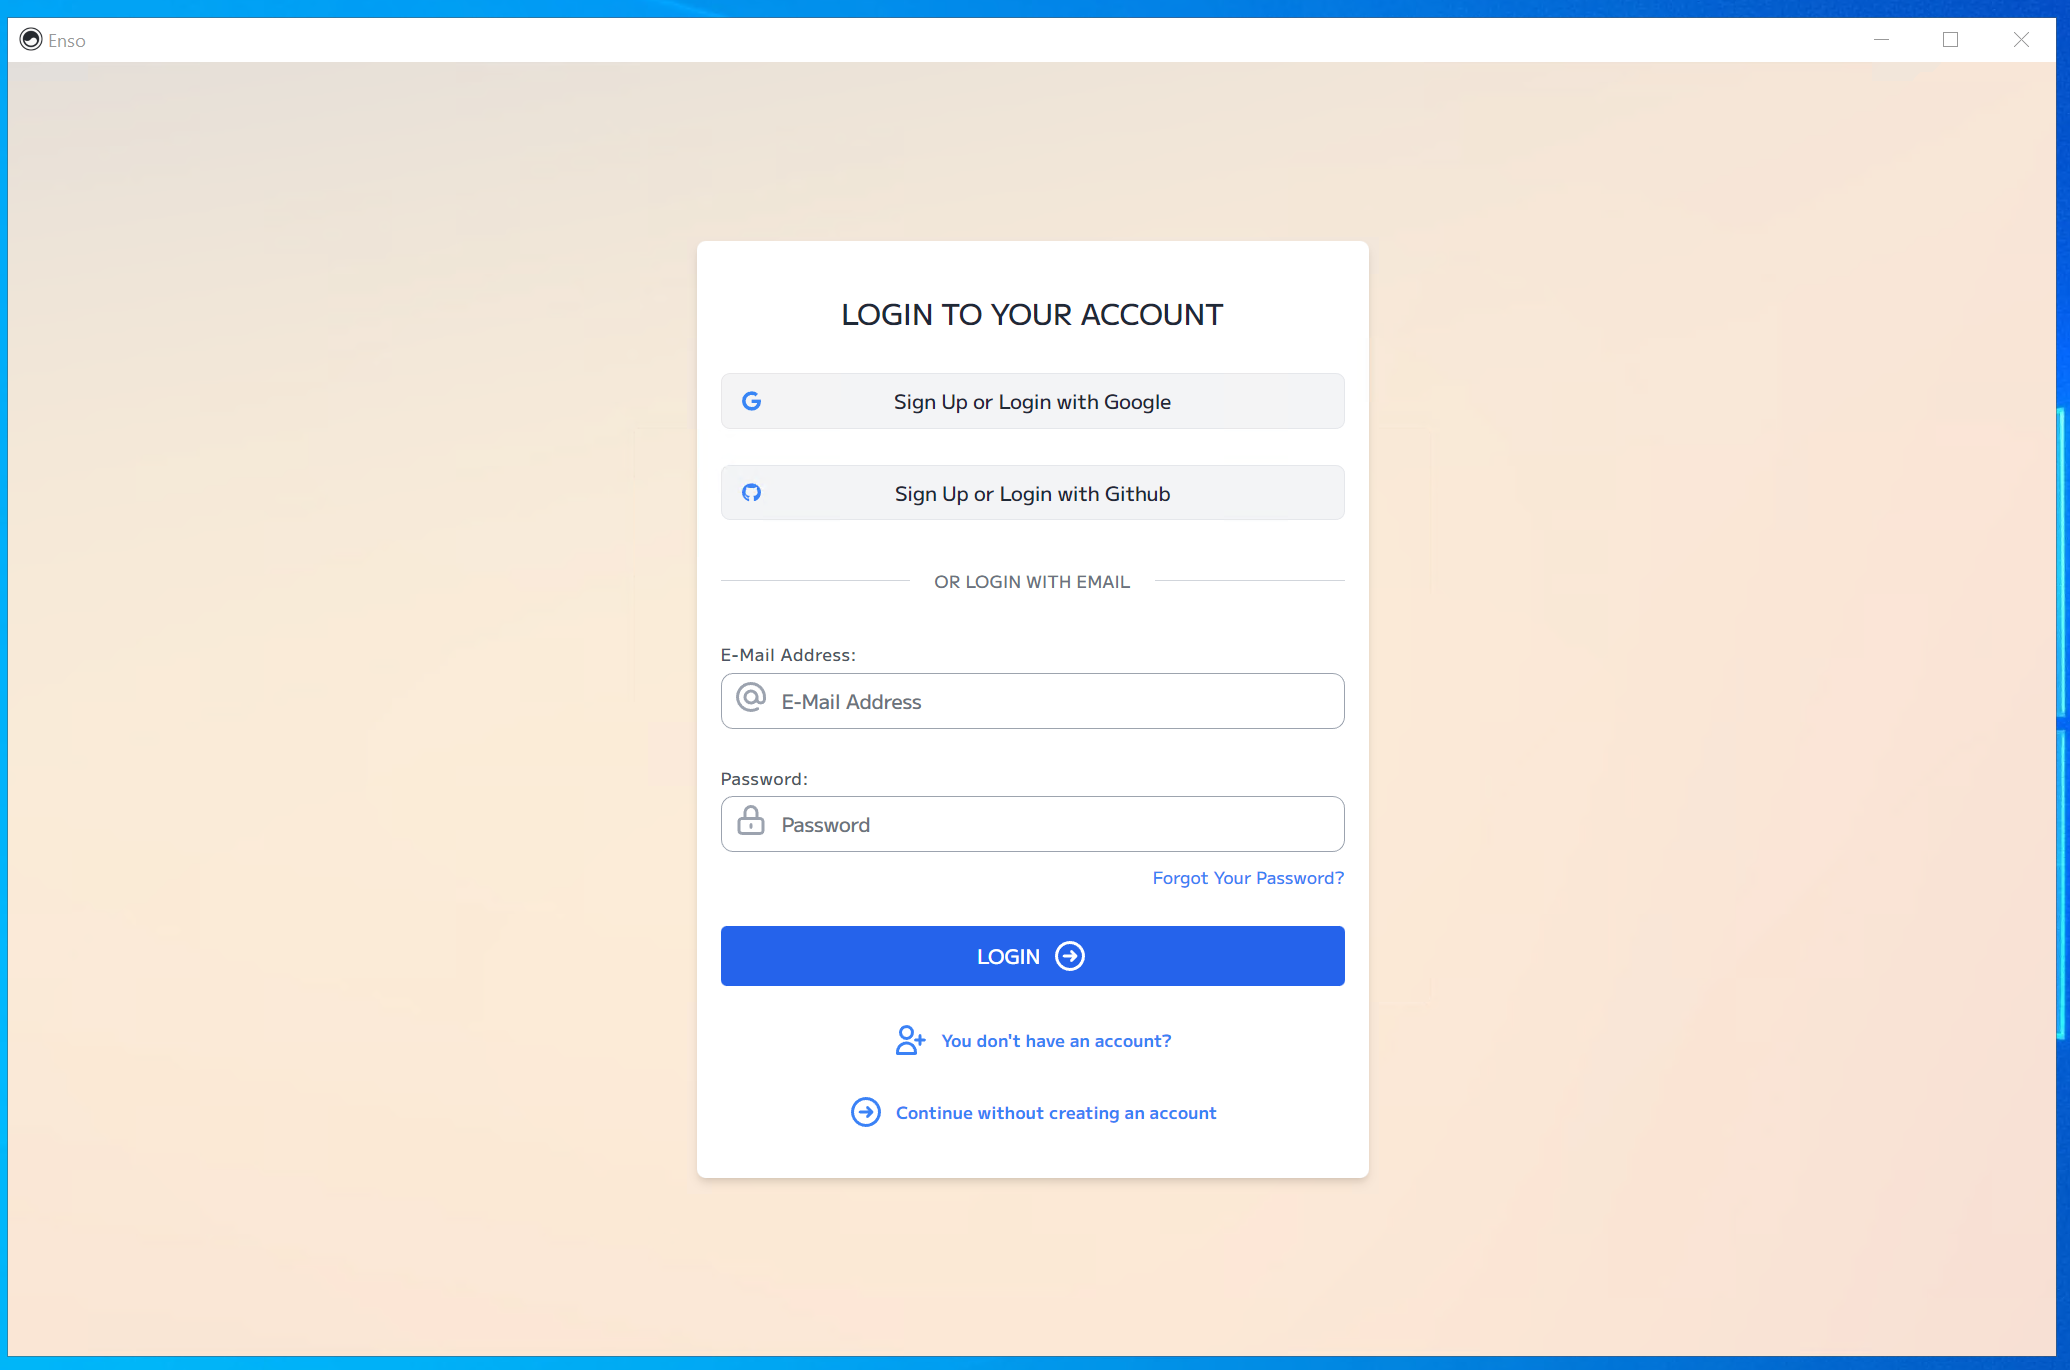
The login is optional, and there is an option at the bottom (“Continue without creating an account”) to open the IDE without logging in. The login will be used in the future for our cloud product and support chat, but you do not need it to use it locally.
If you do create an account or log in, then click on the “Local” button at the top to switch to running on your local machine. You will then see the following screen:
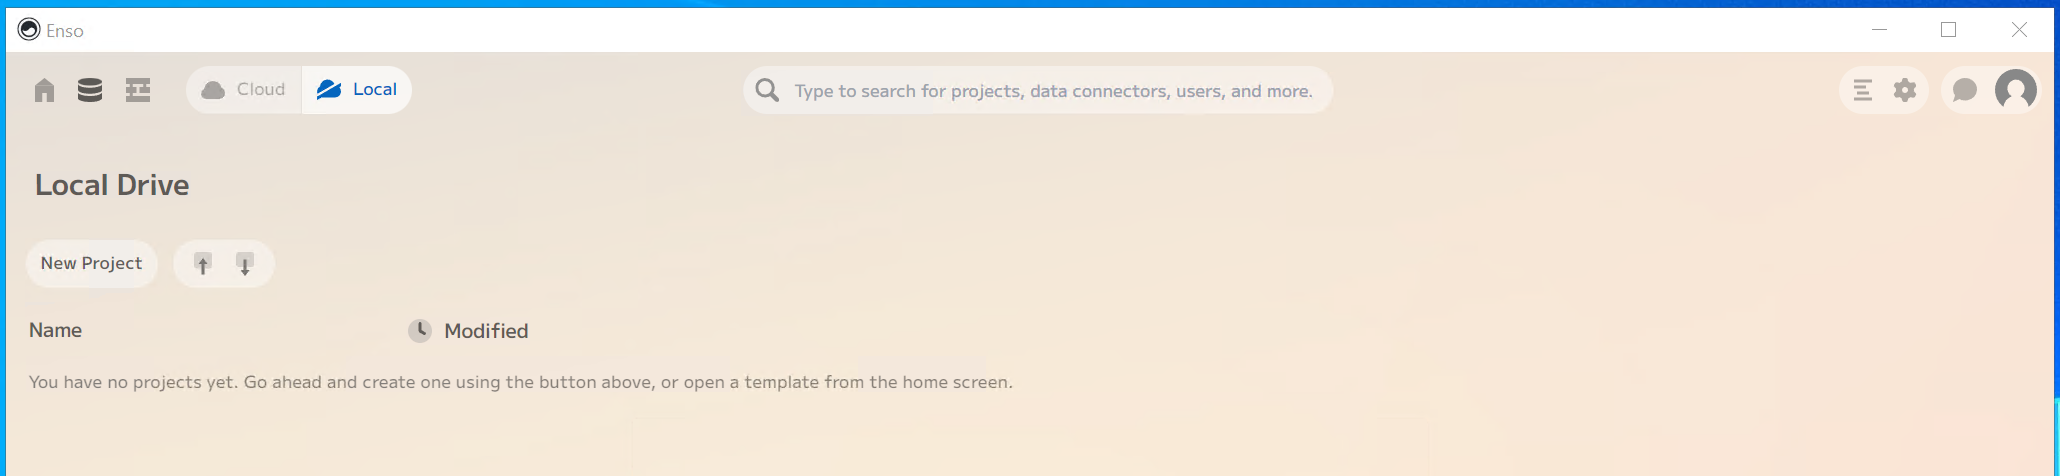
Click on the New Project button, and it will create an empty new project and
set up everything needed to run it. The first opening can take a little longer
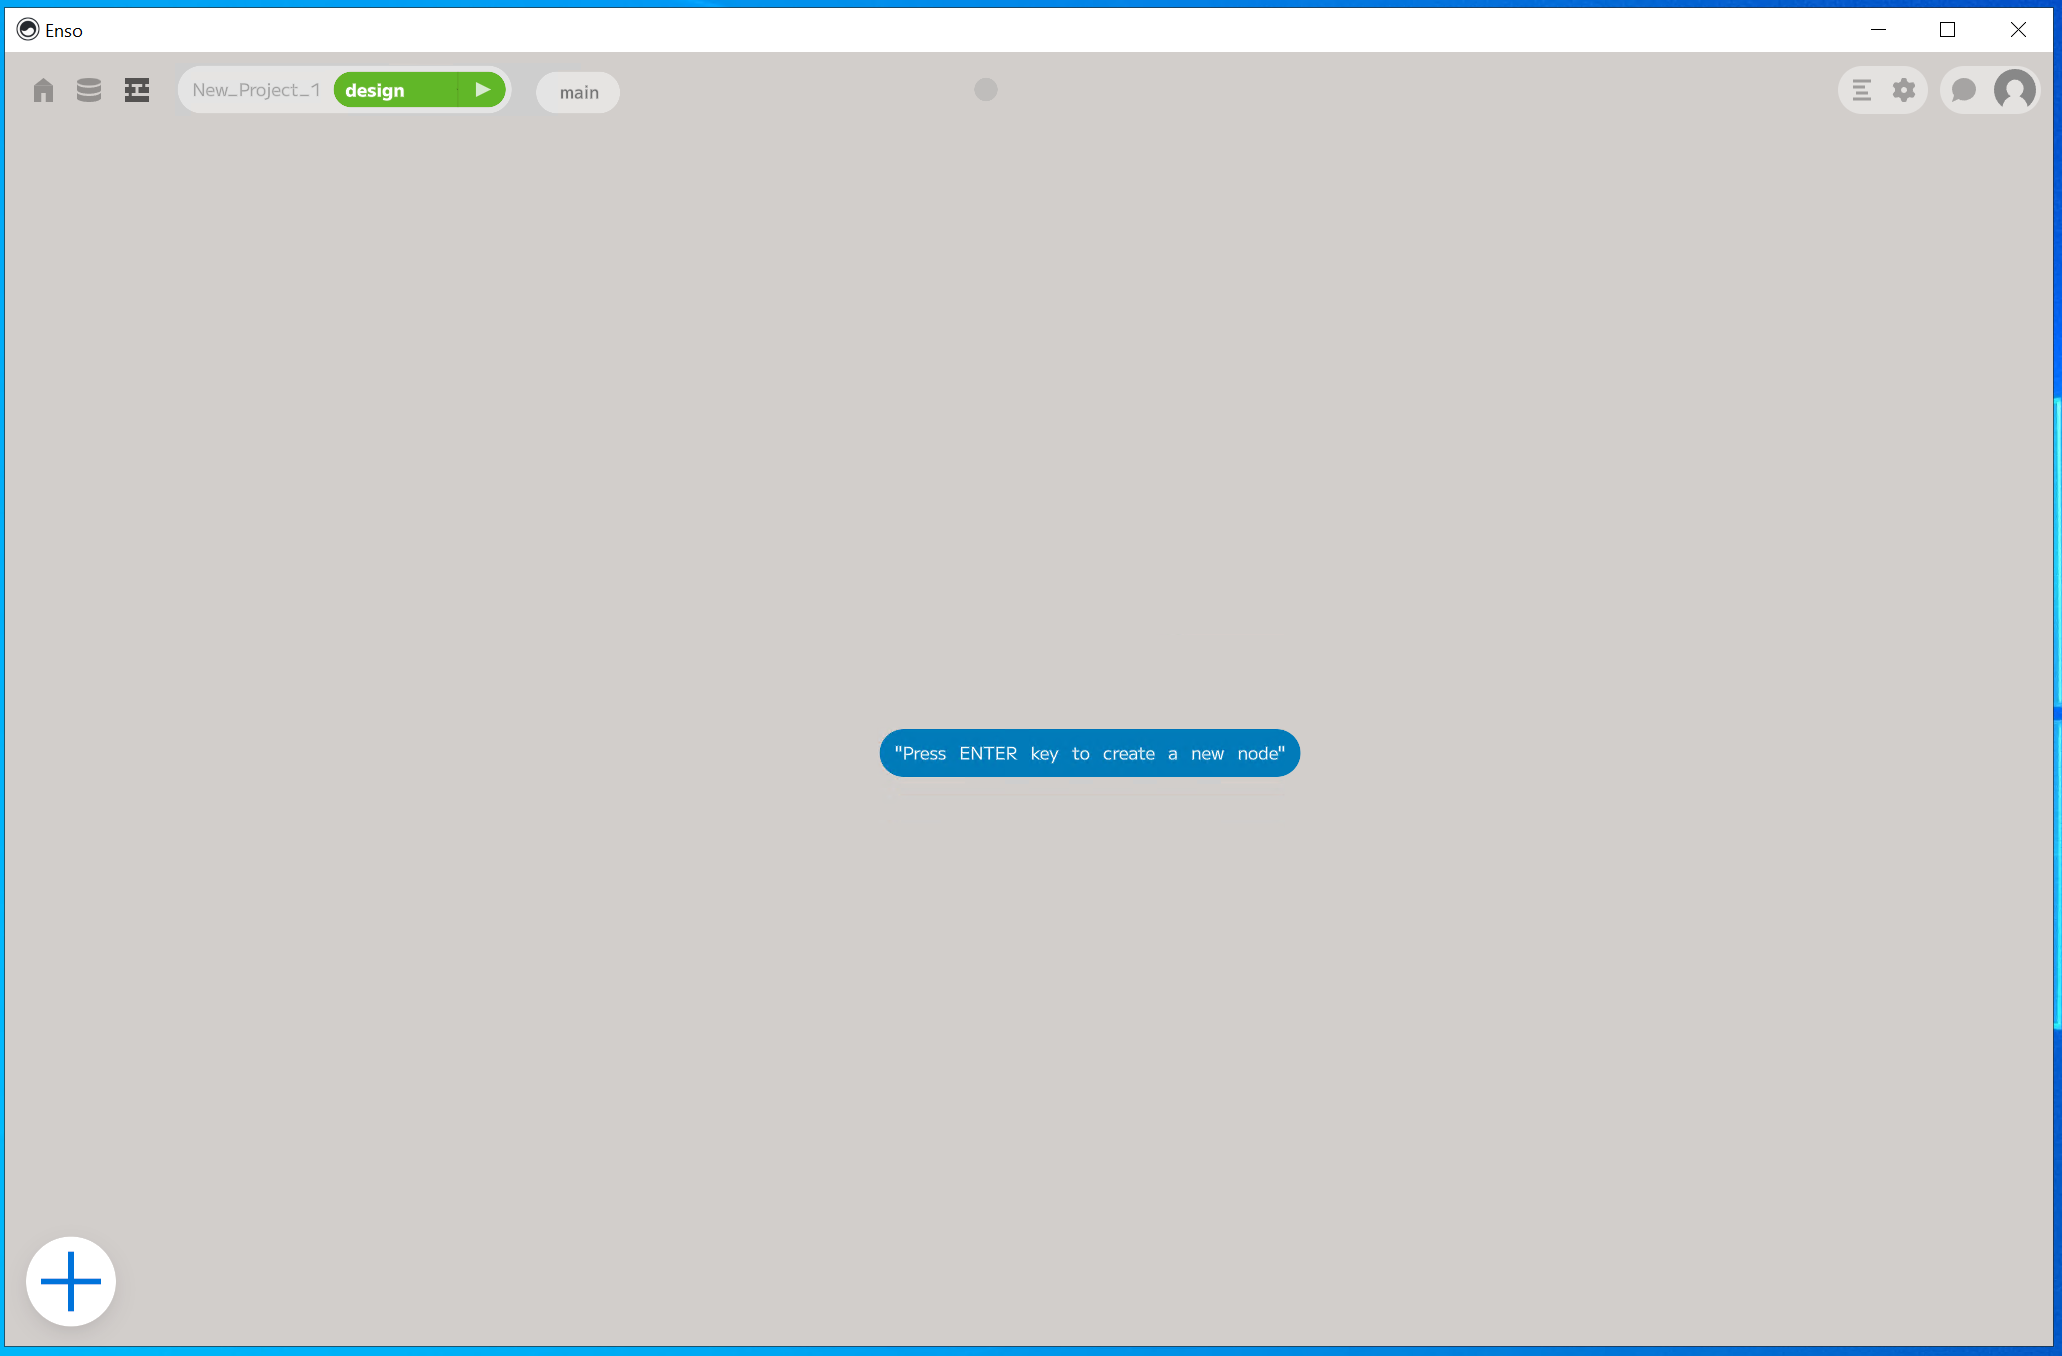
while it expands the runtime behind the scenes. Once it has finished, you will
see the following screen with a single node:
Reading in a File
The simplest way to bring data into Enso is to drag a file onto the IDE. The file will be copied into the project, and a node referencing it will be added to the graph:

Let’s have a look at the code the node created:
enso_project.data/“Sample - Superstore.csv” . read.
The first part, enso_project, is a variable referring to the current project.
It has a few properties and methods on it.
For now, we will look at the data method, which refers to a folder in the
project where files can be stored and used efficiently. To call this method, use
the . operator on enso_project followed by the method name. Projects in Enso
are stored in your home directory (typically within C:\Users\<Username>)
within a folder called enso and then projects. If you explore this folder
and then go into New_Project_1 (the default name for a first project), you
will find a folder called data containing a file called
Sample - Superstore.csv — the file dragged into the IDE.
To access the specific file within a folder, use the / operator followed by a
text value with the name. In Enso, text values can be either in single quotes
(’) or double quotes (”). If using single quotes, then escape characters
such as \n and \t are interpreted. If using double quotes, then they are
not. So enso_project.data/“Sample - Superstore.csv” returns a File object
representing this.
To read the file into Enso, use the read method. The spaces around the .
operator means it will process the expression to the left first and then call
read on the result. The read method will attempt to deduce the format
automatically based on the extension.
Now, take a quick look at the node itself:

To the left of the node are two icons. The first icon controls whether output nodes are “live” or disabled. This post will ignore this functionality. The second icon opens the visualisation of the node. In Enso, nodes are evaluated as you add or edit them, and you can use the visualisation to see the results as you work.
To the node’s right, the variable name is shown (operator2 in this case),
where the result of the node is stored; you can use this name to refer to this
node anywhere later in the graph.
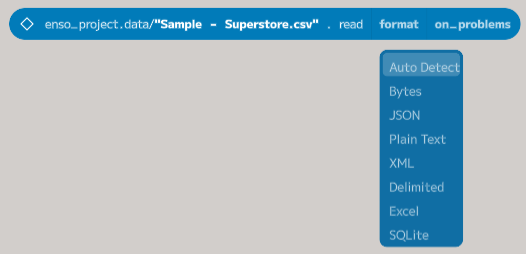
Finally, within the node, you can see the code used to create it and
placeholders for the two optional parameters of the read method (format and
on_problems). If you hover your mouse over these (or the “Sample –
Superstore.csv”), you will see a dropdown arrow at the bottom appear. If you
click here, it will allow you to choose a value.
Note: We are currently working on a new version of the IDE, which will have widgets (such as the dropdowns) for all parameters, but for now, only some have them.
Filtering the Data
Now that the data is loaded, we can start to process it. The first thing is to
filter the data only to include rows where the Category is Furniture. To do
this, left-click on the operator2 node and either press return or drag from
the bottom edge to add a new node.
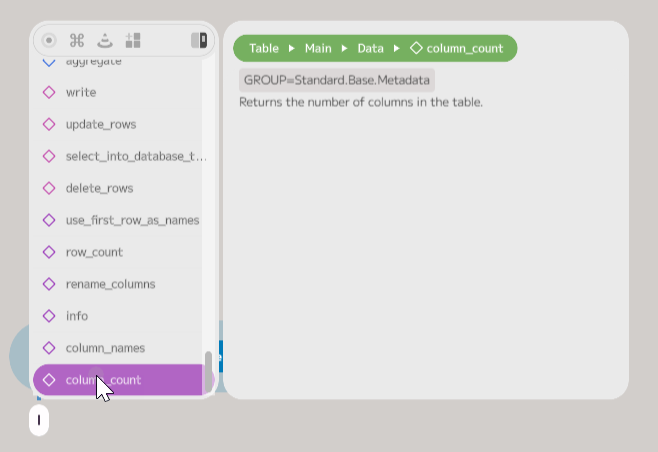
Doing this creates a new node and opens the component browser. The component
browser allows you to search for methods to add to your graph. In this case, we
are looking to filter the data, so either type filter or scroll up in the list
to find the filter method. Click on it to add the method to the node. The
component browser will search as you type, and you can press return when the
required method is shown to add it.

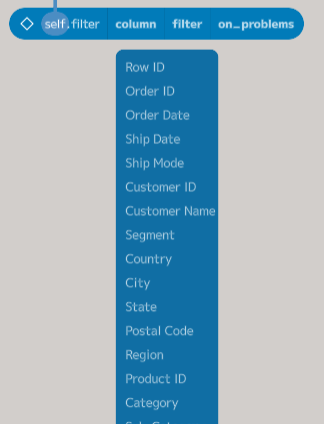
The filter method takes two required parameters and one optional one. The
first is the column within the table to filter, and the second is a filter
condition to be checked. The optional parameter, on_problems, is a common
argument to many functions specifying what to do if there are any problems with
the data. For now, we will ignore this parameter.
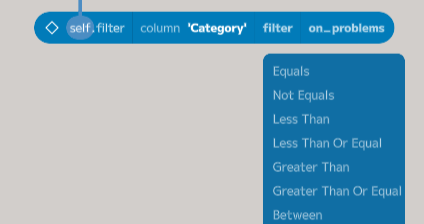
Click on the column parameter and then choose Category from the dropdown.
Next, click on the filter placeholder and choose Equals:
The filter node now needs a value for the right side of the equals condition.
For this case, the goal is to filter when equal to Furniture. There are two
ways to do this — edit the node and type value (I will cover this in another
post) or add a new node providing a constant value of Furniture. To create
this new node, click the + icon in the bottom left of the IDE. A new node is
added, and the component browser is opened. In this case, type “Furniture”
(please include the quotation marks in this node) and press return. You can then
drag from the bottom of this node and connect it to the to placeholder within
the filter node.

Ordering and Selecting 5 Biggest Sales
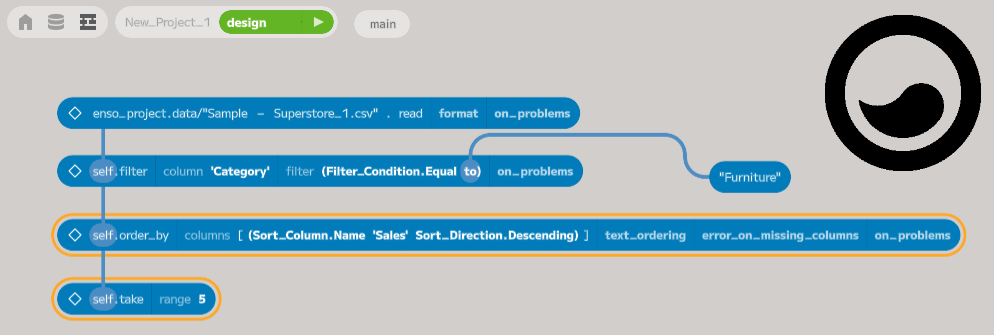
Now that the data is filtered to the furniture orders, the next step is to order
by the Sales column in descending order. The process is as before: press
return to add a new node and search for the order_by method.

The columns parameter takes a list of columns to order by. To add an item to
the list, click on the right-hand side of the placeholder (when a green plus is
shown). A single entry will be added, with a dropdown that allows the column to
be chosen. The added code defines a Sort_Column, which refers to a column in
the table and specifies how it should be sorted. In this case, we want to choose
Sales from the first dropdown and then change the direction to Descending
(by default, it will be sorted in ascending order).
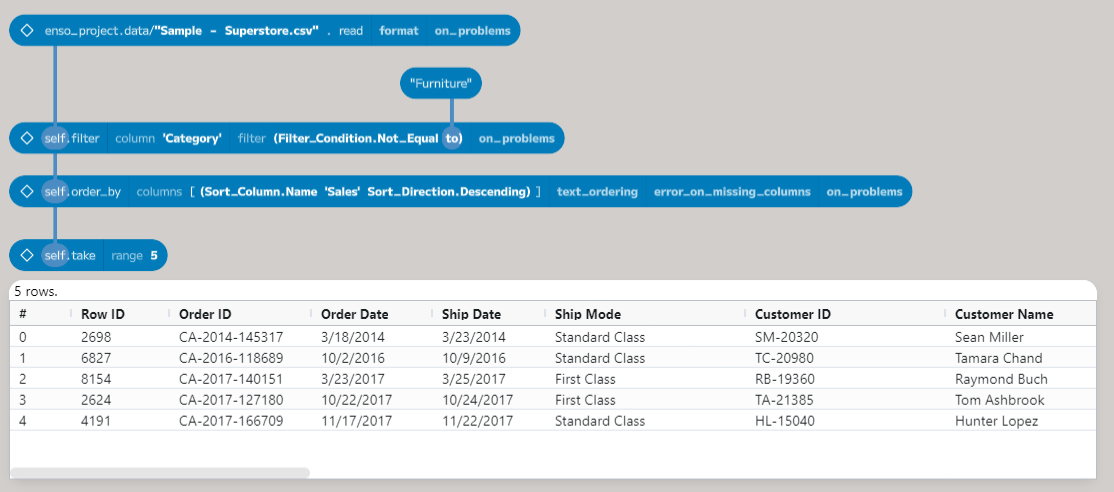
The final step is to take the first five records. To do this, select the order
by node and add a new node. If you type take it will show the method. You can
press enter at this point, and the method will be added, and you can configure
it in similar ways as before. Alternatively, you can type take 5 and press
return, and it will add the new node, picking the required rows.
Renaming the Project
![]()
The last thing to do is to rename the project. To do this, click on the second icon at the top left of the IDE, taking you back to the list of files. The left icon will open a home page with some templates, and the right icon will take you back to the graph editor you have been using.

Find the “New Project 1” entry and click the stop button. You can then rename it using the right-click context menu or pressing Ctrl-R. Once renamed, you can click the play button to reopen the project.
Wrapping Up
In this post, we worked through reading a CSV file and doing some initial data processing in Enso. Next time, we will dive into parsing data from some columns and aggregating the results.
I hope you will try out Enso and let us know what you think. If you have any questions, please join our Discord server.