 Cassandra Clark
Introduction
Data comes from a variety of different sources. A common source used in Marketing is Google Analytics. We’re going to focus on connecting to Google Analytics, running a report using Enso, and then bringing in a second, external data source, as marketing data is rarely housed in only one location.
Connecting to Google Analytics
To connect to your Google Analytics for use in Enso, we’ll need to create a service account. There’s an in-depth guide to this in Google’s documentation. Follow steps one and two of this guide to enable the Google Analytics API and create a service account. You’ll then be able to download a credentials.json file. Once you have this file and have configured the service account with Viewer permissions on your property, we’re ready to access data in Enso.
To use your service account in Enso, you can pass in the credentials file, or set up an Environment Variable called GOOGLE_APPLICATION_CREDENTIALS. This will be used automatically to authenticate with your service account in Enso.
Querying Google Analytics in Enso
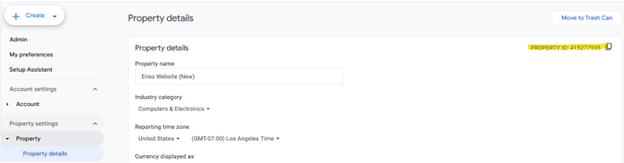
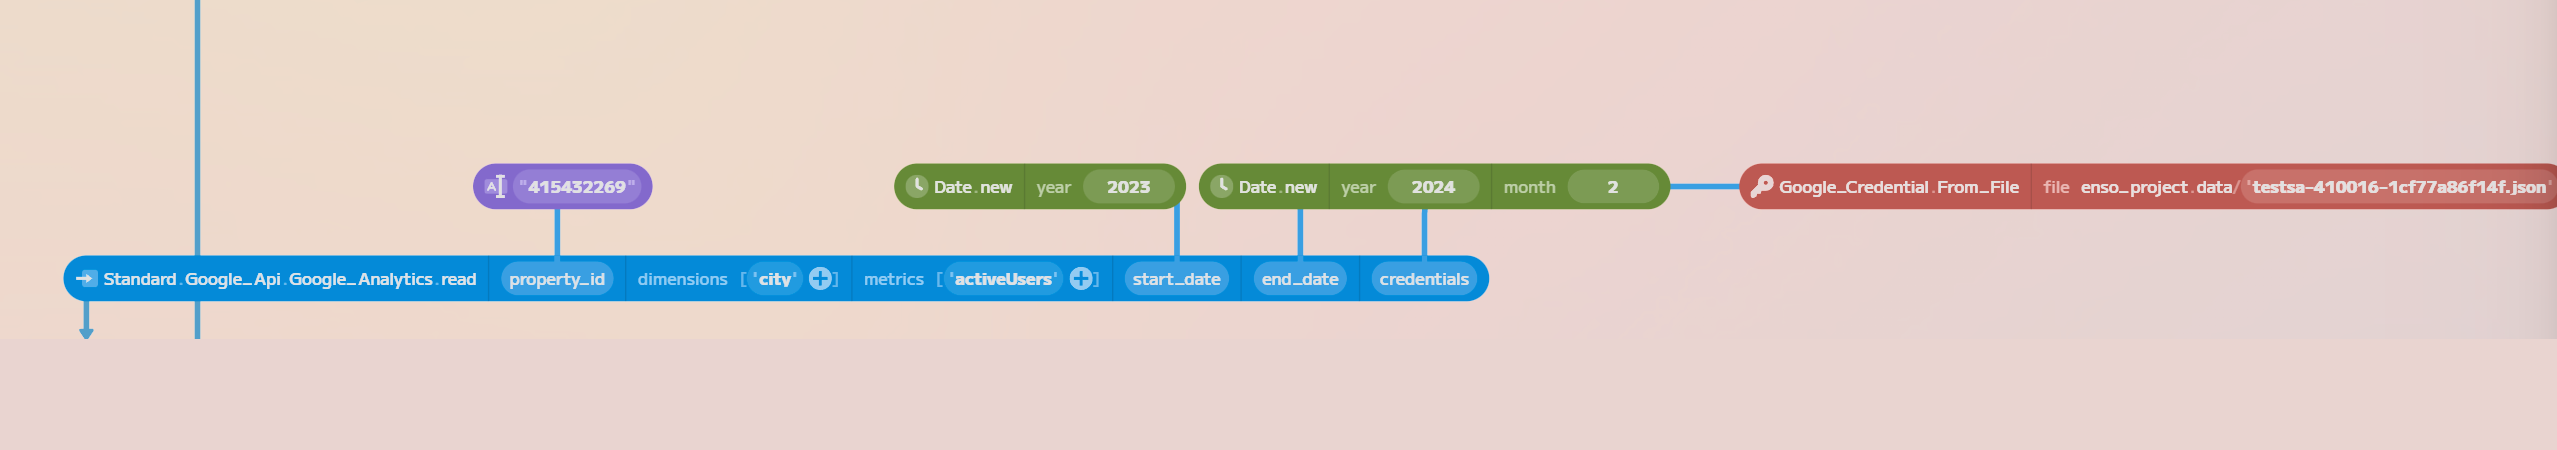
To run a report in Enso, we’ll use the method Google_Api.Google_Analytics.Read. Here we’ll specify the property_id to query. This can be found at https://analytics.google.com/ under the Property details tab of the Admin panel.
We can also specify the metrics we are reporting, and the start_date and end_date for the report. We’re passing in the property_id from a constant, but this could be a variable from a file or another data source, allowing for easy parameterisation of this query.
Prepping Offline Data
Next, we can bring in an ancillary dataset. For this example, we’ll use an Excel workbook that contains a ton of useful marketing information, although we only care about the counts by city, as an external datasource.

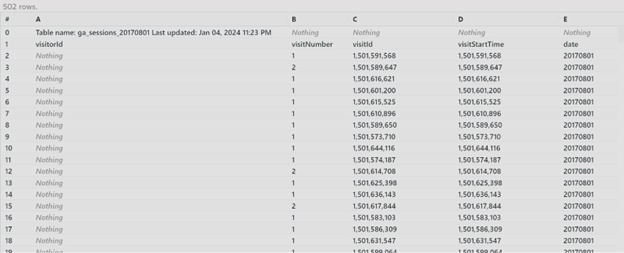
Looking at the data, we can see that this Excel file needs some massaging for it to be useful to us. The first row contains information about the extract itself, and the second row seems to contain our field names.
We can remove the first row with the helpful drop method.

Next, we can use_first_row_as_names to take our column names from the sheet.

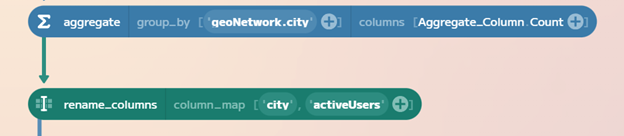
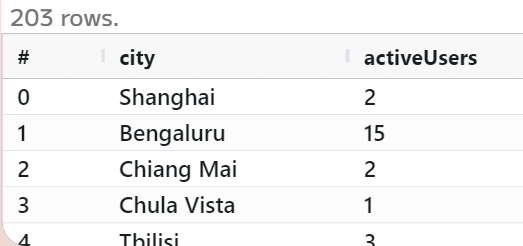
We can aggregate our data, grouping by city to get a count of visits per city. We’ll rename our columns to city and activeUsers for simplicity further into our analysis.
Merging Datasets
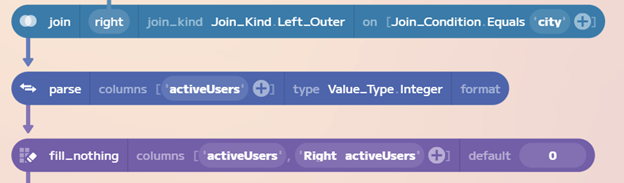
Now, we can connect our data together with a Join on city, and we can use the parse method to parse activeUsers as an integer. Since we used a Left Outer Join, we’ll use fill_nothing to clean up the data in our right activeUsers field as well, so we can combine these datasets together.
From here, some simple addition via the set function lets us combine our data together, and we can use select columns to get rid of our extraneous fields from the ancillary dataset.


Conclusion
Now we have our combined dataset with all of the unique visits by city.
In this blog, we went over setting up a service account for Google Analytics, connecting to a property and running a Google Analytics report in Enso, and merging the data together with another dataset. This powerful functionality enables on demand analytics across a variety of data sources through the power of Enso.